I’m Luke Craven; this is another of my weekly explorations of how systems thinking and complexity can be used to drive real, transformative change in the public sector and beyond. The first issue explains what the newsletter is about; you can see all the issues here.
Hello, dear reader,
It has been a while since I have talked about System Effects—my pet system mapping methodology/software—and the impact that it has been making in the world. I fondly refer to System Effects as my side hustle, but I have not been giving it anywhere as much attention recently as it deserves, despite some very exciting developments.
For newer readers, this is also an opportunity to learn a bit more about the methodology, experiment with the software, and see what both are capable of.
What is System Effects?
System Effects is a tool that enables researchers and policymakers to aggregate and quantify user-generated system maps of a problem and the factors associated with it.
I developed System Effects as part of my PhD which explored the barriers to food access in migrant communities. At the time I was deeply frustrated that there was no way to bring together a group of extremely diverse system maps to understand population-level dynamics and reveal possible leverage points, while also respecting the uniqueness of individual perspective and experience.
System Effects was a response to that specific challenge, but it has a much broader application. It can be used to ask a range of questions about any issue, focusing on how different impacts, barriers, and enablers exist and are perceived within the system that surrounds it.
For example, if the focus area is food security questions might be:
💥 Impacts: how are individuals impacted by food insecurity?
🚧 Barriers: what barriers do individuals face in accessing healthy, nutritious food?
✅ Enablers: how do food insecure individuals cope with not being able to access healthy, nutritious food?
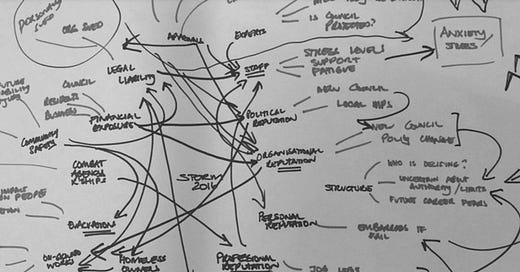
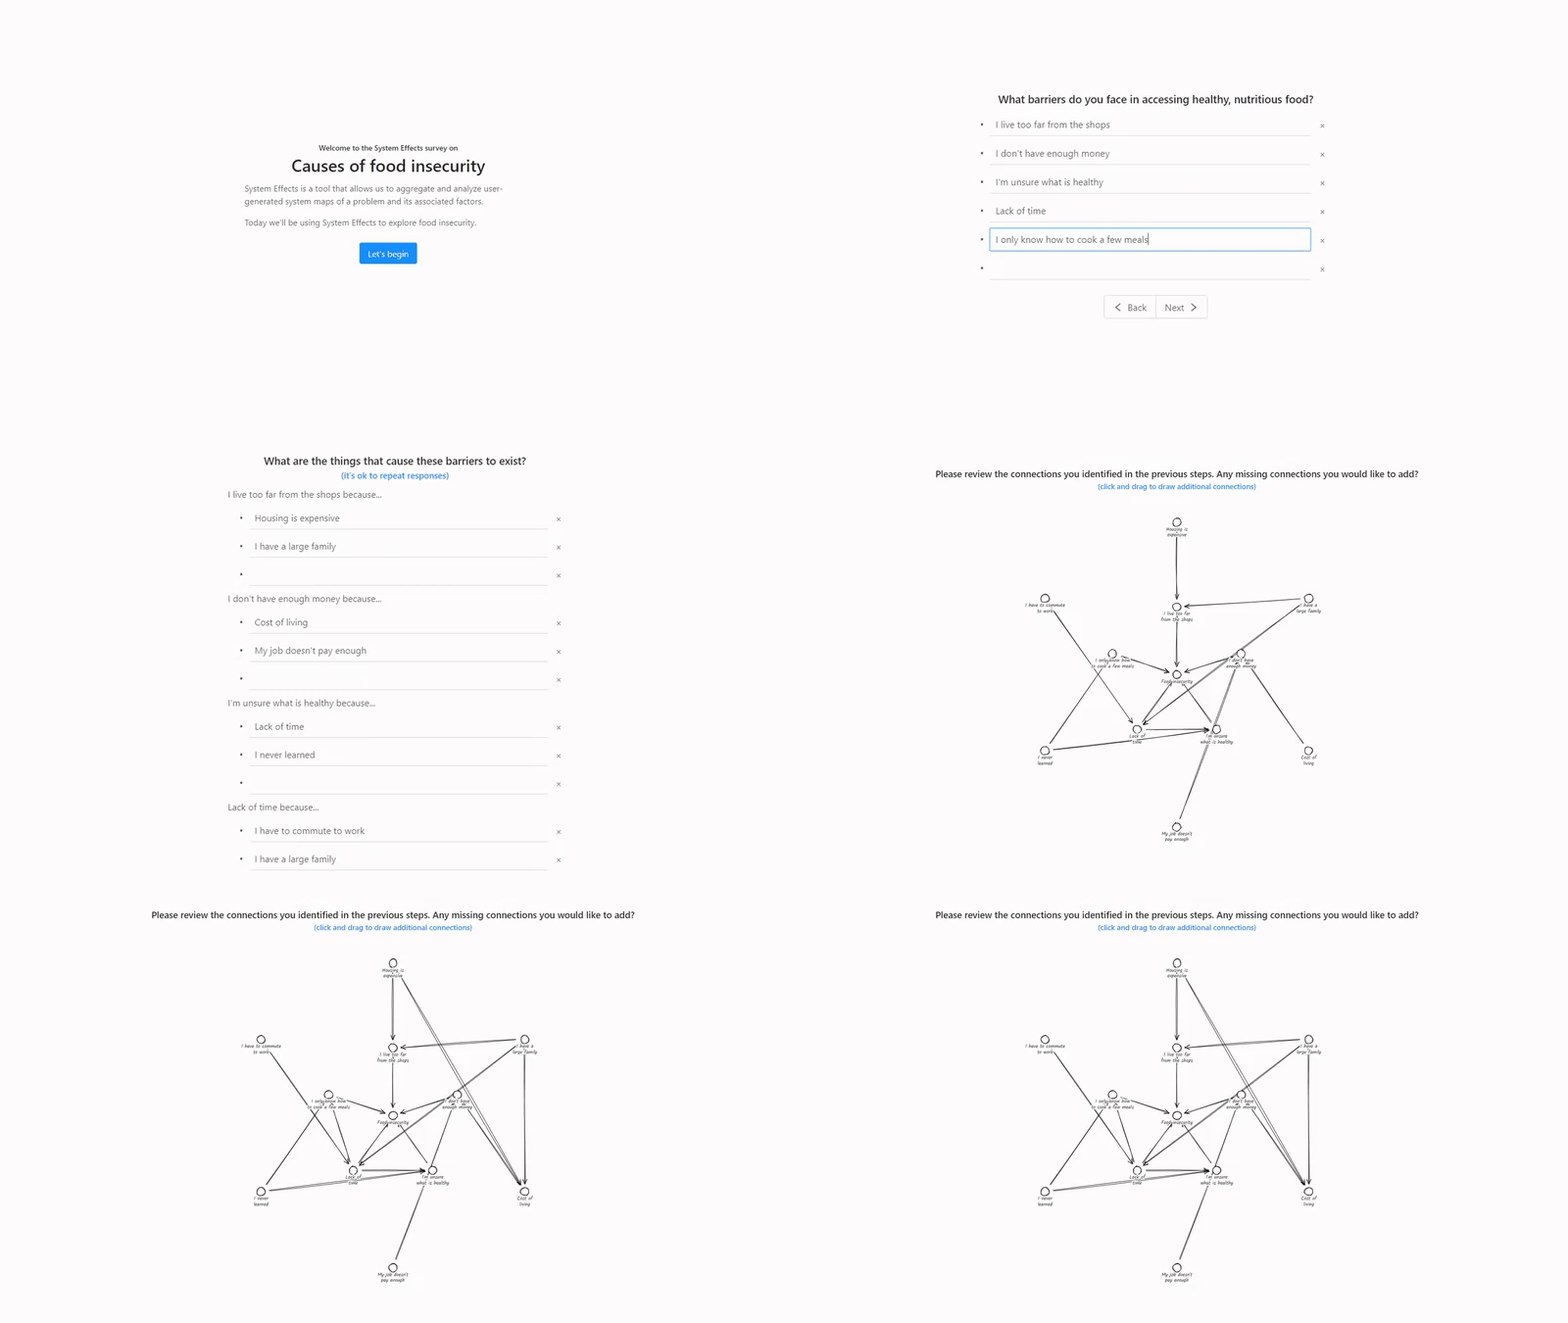
In each case, users are invited to ‘map’ their response. Mapping the problem prompts the user to consider their position and use reflection to identify components of the issue and illustrate links between these components.
These individual maps are then aggregated to build a picture of the wider community experience. The method that sits behind the aggregation ensures no individual variable or causal connection is ignored while highlighting the shared experiences emerging at the population level. It also provides the opportunity to use a whole bunch of network science tools to help policymakers understand the structure of the system and where they might be able to intervene.
Where is it making an impact?
I like to tell myself I am a tech-savvy person—there’s truth to every lie!—but for a good chunk of its life, System Effects was a clunky, manual process. Early adopters will tell you that both data collection and analysis were tedious, with a high rate of user error.
My collaboration with Ryan Mohr and the Kumu family changed all of that. With Ryan’s genius, we were able to create an online tool to automate elements of data collection and analysis. We simplified the way maps could be generated through survey-based elicitation and streamlined the data analysis process.1
👉 You can try it for yourself by clicking here.
Over the weekend, we’ve clocked 50 use-cases of the methodology since I started actively proselytising about it in late 2016. I’m tremendously proud of that reach in a relatively short time. While a good chunk of those use cases stay hidden away in internal documentation, it’s heartening to see that many others are being shared publicly, including:
🧹 A study into the barriers and enablers to the repair of electrical equipment conducted by the UK Department for Environment, Food and Rural Affairs
🌬️ A project to tackle Asthma in vulnerable communities led by Asthma Australia and funded by the Australian Department of Health
💼 A project to explore the barriers to labor market entry experienced by job-seekers registered with the Norwegian Labor and Welfare Administration
That’s just a snippet of the excitement and there are more really interesting applications on the horizon, focusing on issues as diverse as the health of waterways in Aotearoa New Zealand, and the management of pork tapeworm in Uganda. Watch this space!
How can you get involved?
Seriously, I could talk about this stuff for hours, so please don’t hesitate to get in touch if you are interested in exploring how System Effects could help you understand the challenges you face.
📈 Commercial use. System Effects surveys are available through Kumu’s online platform for $700USD/survey. Each survey explores a single dimension (impacts, enablers, or barriers) of a particular focus and includes an unlimited number of responses. If that’s a barrier for you, please reach out anyway. There are a range of options I am happy to discuss.
🔬 Research partnerships. I’m also keen to hear from students and researchers that are interested in applying/stretching the methodology as part of Honours, Masters or PhD research projects. For people with expertise in data science and network analysis, there are some exciting opportunities to play and I’m open to experimenting with partnerships of different shapes and sizes.
By the way: This newsletter is hard to categorise and probably not for everyone—but if you know unconventional thinkers who might enjoy it, please share it with them.
Find me elsewhere on the web at www.lukecraven.com, on Twitter @LukeCraven, on LinkedIn here, or by email at <luke.k.craven@gmail.com>.


